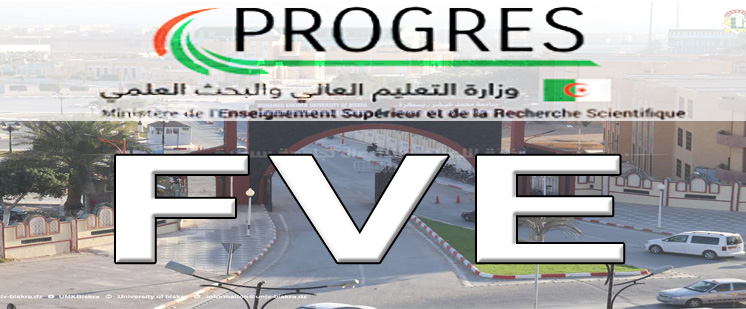
DISPLAY THE DISEASE PLACE FOR NON LINEAR MODEL WITH “ ANOVA” TECHNIQUE

  • K. EL KOURD Department of physical ,preparatory school of sience & technicalof Algiers-Algeriabc
  • A. AZZIZI Electronic of engineering of Med khider of Biskra,
  • F. BOUGOURZI Electronic of engineering of Med khider of Biskra,
  • S. HAMMOUM Clinical of radiology-MRI service-view Kouba-Algiers

Résumé

ABSTRACT
In this paper, we transform a nonlinear model to a linear one by using numerical analysis with ‘‘Runger-Kutta4(RK4)’’. Which
is a mathematical technique to approximate solution of ordinary differential equations; this method is most popular where the
step size H is working to increase the lighting of the image compared with the original picture. The new data (normal &
pathological images) obtained from this method is used in the statistical study of simple regression and “ANOVA” technique
to detect the tumor of MRI images. After that, we study the linear regression and “ANOVA” technique by using ANOVA
statistical test (equation of ANOVA: fcal) and compare it with ANOVA table(ftab) for probability p-value =0.01 (here for
area 200x200, ftab=1) and see all pixels inferior to‘’1’’ that means the hypothesis ho is accepted. All these detail is to extract
the place of the lesion on MRI ,(which contain matrix data of normal image and pathological ones), the extract the accepted
ho pixels directly on the pathological image. The simulation program applied here is Matlab.
KEYWORDS: Runge kutta ,linear regression, Anova.

Références

[1] David G. Herr.1986. On the History of ANOVA in
Unbalanced, Factorial Designs: The First 30 Years.
The American Statistician, 40.4. 265-270.
[2] Hogg, R. V., and J. Ledolter. 1987.Engineering
Statistics. MacMillan Publishing Company.
[3] John H.Mathews, Kurtis D.Fink , 1999, Numerical
Method using Matlab .3rd ed ,Prentice Hall, upper
saddle river,NJ07458,.458-459.
[4] Atkinson, Kendall A. 1989, An Introduction to
Numerical Analysis .2nd ed, New York: John Wiley
& Sons, ISBN 978-0-471-50023-0 .
[5] Ascher, Uri M.; Petzold, Linda R. 1998, Computer
Methods for Ordinary Differential Equations and
Differential-Algebraic Equations, Philadelphia:
Society for Industrial and Applied Mathematics,
ISBN 978-0-89871-412-8.
[6] Armstrong, J. Scott 2012. Illusions in Regression
Analysis.International Journal of Forecasting .28 .3:
689.
[7] York .1966. Least-squares fitting of a straight line.
Canad. J. Phys. 44: 1079-1086.
[8] Uts, J. and R. Hekerd.2004. Mind on Statistics.
Chapter 16 - Analysis of Variance. Belmont, CA:
Brooks/Cole - Thomson Learning, Inc.
[9] T. Dudok de Wit 2010. ANALYSE NUMÉRIQUE,
Licence de physique – 3ème année, Université
d’Orléans – Faculté des Sciences,Université
d’Orléans.
[10] Plonsky, M.2007. One Way ANOVA.Retrieved from:
http://www.uwsp.edu/psych/stat/12/anova-1w.htm.
[11] K.El Kourd.A.El kourd .2013, The Detection of
disease by statistic test of .Analyze of variance.
Journal IEEE.ISBN 978-1-4673-5285-.
[12] Gear, C.W. 1971. Numerical Initial Value Problems in
Ordinary Differential Equations (EnglewoodCliffs,
NJ: Prentice-Hall).
[13] From:http://www.weibull.com/DOEWeb/introduction.
ht;12/6/2012, 15:45.
[14] Research Methods I, ANOVA and Multiple
Regression.
[15] Viviane Kostrubiec .Les comparaisons multiples:
entre mythe et réalité. ;Laboratoire Adaptations
Perceptivo-Motrices et Apprentissage (EA
3191).Université Paul Sabatier–Toulouse III.
[16] Jon Roiser and Predrag Petrovic.2006 . t-tests,
ANOVA and regression.
[17] R.Henson. and W.Penny.2005 .ANOVAs and
SPM.Institute of Cognitive Neuroscience,Wellcome
Department of Imaging Neuroscience,University
College London.
Publiée
2015-03-17
Comment citer
EL KOURD, K. et al. DISPLAY THE DISEASE PLACE FOR NON LINEAR MODEL WITH “ ANOVA” TECHNIQUE. Courrier du Savoir, [S.l.], v. 19, mars 2015. ISSN 1112-3338. Disponible à l'adresse : >https://revues.univ-biskra.dz/index.php/cds/article/view/1213>. Date de consultation : 20 avr. 2024